

Published March 30, 2026
Optimizing Istio for Large-Scale Enterprise Applications
Overview
In today’s rapidly evolving cloud-native application landscape, adopting service meshes has become vital for effectively managing the complexities inherent in microservices architectures. Among the leading solutions, Istio stands out by offering a comprehensive suite of features, including traffic management, security, and observability.
If a large enterprise is expanding its use of Istio, performance optimization should sit front and center in the overall implementation strategy. Below, I’ll delve into proven strategies for enhancing Istio’s performance in large enterprises.
Sidecar resource usage and sizing
Managing Istio sidecar resources can pose significant challenges that often go unnoticed, potentially leading to application issues if not addressed properly. The default resource requests for the sidecar are 128Mi for memory and 100m for CPU, with limits set at 1Gi for memory and 2 cores for CPU.
When to Update CPU Requests
- The Envoy proxy consumes approximately 0.5 vCPU per 1000 requests per second. CPU requests should be increased when transactions per second (TPS) are high, and the Istio sidecar approaches its configured CPU limits.
When to Update Memory Requests
- The Envoy proxy uses 50 MB of memory per 1,000 requests per second going through the proxy. When numerous entries—such as egress or import and export resources—are added to the namespace, the sidecar will require additional memory to manage these configurations effectively.
The sample deployment configuration below provides a guide for modifying resource requests and limits. It’s crucial to specify limits for both CPU and memory; omitting these will result in limits being set to unlimited, which could lead to resource contention and instability.
spec:
  replicas: 1
  selector:
    matchLabels:
      app: myapp
  template:
    metadata:
      labels:
        app: myapp
      annotations:
        sidecar.istio.io/proxyMemoryLimit: 3Gi
        sidecar.istio.io/proxyCPULimit: '3'
        sidecar.istio.io/proxyCPU: '1'
        sidecar.istio.io/proxyMemory: 2G
When to use L4 over L7
Istio is capable of handling both Layer 7 (L7) and Layer 4 (L4) communications during pod-to-pod interactions, depending on the protocol specified for the destination Kubernetes service. If the appProtocol is set to ‘tcp’, Istio treats the connection to that service as an L4 connection; otherwise, it is classified as L7.
In high-traffic scenarios where multiple hops are required between microservices before reaching the final response, each hop adds additional latency. If L7 controls are not required, disabling them can improve latency when using Istio.
| Layer | Use When | Examples |
|---|---|---|
| L7 | Advanced traffic routing, observability, or security for HTTP/HTTPS traffic is needed. | Canary deployments, API routing, fault injection. |
| L4 | Protocol-agnostic traffic management or low-latency handling for non-HTTP protocols is needed. | Database traffic, gRPC, streaming services. |
L7 destination [appProtocol as ‘http’]:
kind: Service
apiVersion: v1
metadata:
  name: myapp
  namespace: mynamespace
spec:
  ipFamilies:
    - IPv4
  ports:
    - name: http-8080
      protocol: TCP
      appProtocol: http
      port: 8080
      targetPort: 8080
  internalTrafficPolicy: Cluster
  type: ClusterIP
  ipFamilyPolicy: SingleStack
  sessionAffinity: None
  selector:
    app: myapp
L4 destination [ appProtocol as ‘tcp’]
kind: Service
apiVersion: v1
metadata:
  name: myapp
  namespace: mynamespace
spec:
  ipFamilies:
    - IPv4
  ports:
    - name: tcp-8080
      protocol: TCP
      appProtocol: tcp
      port: 8080
      targetPort: 8080
  internalTrafficPolicy: Cluster
  type: ClusterIP
  ipFamilyPolicy: SingleStack
  sessionAffinity: None
  selector:
    app: myapp
Sample Test results:
In a complex multi-hop microservices architecture (approximately 15 hops), tests show that using L4 yields about 53% better response times compared to L7 for pod-to-pod communication. This highlights the importance of choosing the right traffic management layer to optimize performance in microservices architectures.
With Layer7
TPS graph:
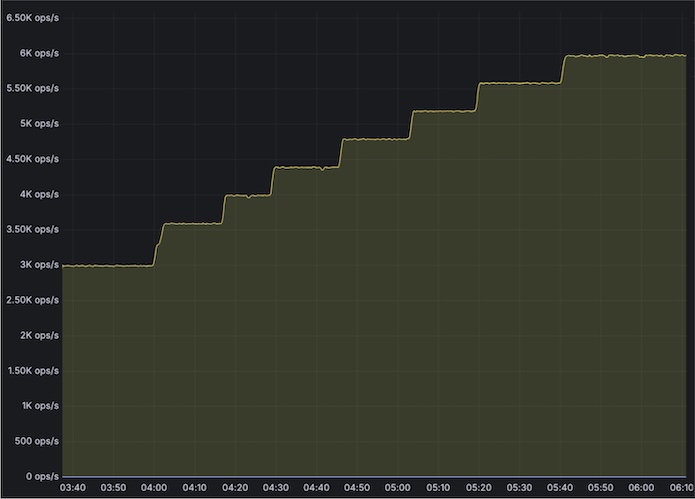
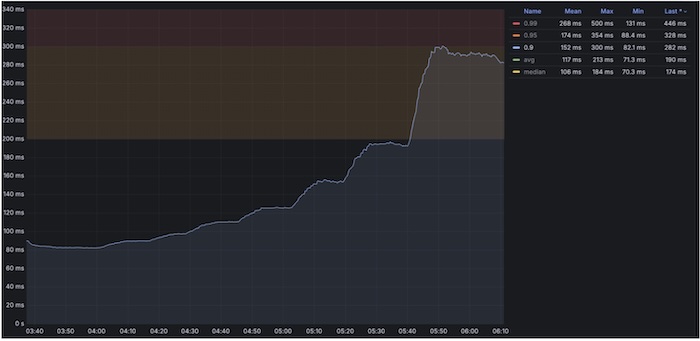
Response time graph [P90 reaching till 340ms at 6kTPS]
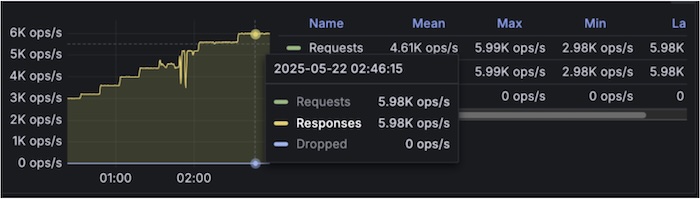
With Layer4
TPS graph
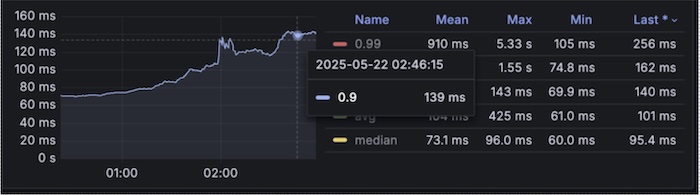
Response time graph [P90 reaching only till 140ms]
Istio Retry logic
The default retry policy for the mesh includes connect-failure, refused-stream, unavailable, cancelled, and retriable-status-codes. It’s important to be cautious about retriable-status-codes, which, when combined with the configuration for http.StatusServiceUnavailable, means that Istio will, by default, retry any 503 error—even those intentionally returned by the service. For applications that may not work with default retries should consider updating retry logic as described in the link below:
https://istio.io/latest/docs/reference/config/networking/virtual-service/#HTTPRetry
Limiting the configuration sprawl that needs to be pushed out
To optimize control plane performance effectively, the most straightforward approach is to minimize the scope and size of the proxy configurations deployed to the data plane. For example, consider a specific workload ‘myapp’. Instead of pushing configurations for all services within the mesh, it’s possible to significantly improve efficiency by only deploying the proxy configuration relevant to workload ‘myapp’ and its dependent services. Utilizing the Sidecar resource allows for precise control over which configurations are sent, ensuring that only necessary data is pushed to the data plane.
apiVersion: networking.istio.io/v1beta1
kind: Sidecar
metadata:
  name: sidecar-myapp
  namespace: 600000392-colleague360
spec:
  egress:
    - hosts:
        - '*/mysecondapp.mysecondappnamespace.svc.cluster.local'
        - '*/myexternalendpoint.com'
  workloadSelector:
    labels:
      app: myapp
Smart DNS proxy
Smart DNS Proxy is a feature in Istio that enhances DNS resolution for workloads within the service mesh. It allows Istio sidecars to intercept DNS queries and resolve them based on Istio’s service registry. There are a few things that need to be evaluated when setting up ServiceEntries for external access.
https://istio.io/latest/docs/ops/configuration/traffic-management/dns/#proxy-dns-resolution
- Switch to
resolution: NONEto avoid proxy DNS lookups entirely. This is suitable for many use cases. - If the domains being resolved are controlled internally, increasing their TTL is recommended.
- If
ServiceEntryis only needed by a few workloads, its scope can be limited withexportToor a Sidecar.
Reduce stampede of DNS requests to upstream
Unlike most clients, which will handle DNS requests on demand before caching the results, the Istio proxy never conducts synchronous DNS requests. When a resolution: DNS type ServiceEntry is configured, the proxy will periodically resolve the configured hostnames and use those for all requests. This interval is fixed at 30 seconds and cannot be changed, this occurs even if the proxy never sends any requests to these applications and regardless of TTL values returned by the DNS server. This can create issues in large clusters with multiple service entries and DNS queries upstream.
The problem: synchronized 30-second DNS refreshes
Because the DNS refresh interval is fixed and identical across all proxies, large Istio meshes can experience highly synchronized DNS lookups. When hundreds or thousands of Envoy sidecars refresh DNS at the same 30-second boundary, a classic thundering herd effect ensues, leading to problems such as:
- Burst spikes in DNS queries every 30 seconds
- Increased load on CoreDNS / kube-dns or external DNS providers
- DNS latency spikes or rate limiting from upstream DNS servers
- Increased control-plane pressure during mass restarts or rollouts
This behavior becomes especially problematic when:
- During events like rolling restarts, deployments, or config pushes:
- Many proxies restart and reinitialize envoy clusters simultaneously
- DNS resolution is triggered immediately during envoy cluster warming
- This stacks on top of periodic refreshes, compounding DNS pressure
- Each Envoy sidecar independently maintains its own DNS cache and schedules periodic asynchronous resolution using a timer-driven event loop. However, since the refresh interval is deterministic and starts at roughly the same time (e.g., proxy startup or cluster warming), thousands of sidecars can align their DNS queries on the same boundary.
- Envoy’s DNS refresh behavior is interval-driven and does not strictly honor upstream TTLs in all cases. When TTLs are low (or effectively overridden by dns_refresh_rate), queries are issued more frequently than necessary.
Fix via PILOT_DNS_JITTER_DURATION
Thankfully, a solution exists. PILOT_DNS_JITTER_DURATION is an Istio configuration that introduces randomized jitter to DNS to refresh scheduling across proxies.
Instead of all Envoy sidecars refreshing DNS exactly every 30 seconds at the same moment, Istio spreads those refreshes across a configurable time window. Each proxy still refreshes DNS on the same fixed interval, but the refreshes are intentionally de-synchronized.
This means:
- The 30-second DNS refresh interval remains unchanged
- Refresh timing is staggered across proxies
- DNS query traffic is evenly distributed over time
Resulting benefits
- Eliminates DNS query bursts caused by synchronized refreshes
- Reduces load and rate-limit risk on DNS infrastructure
- Improves DNS latency stability and P99 behavior
- Makes large Istio meshes more resilient during restarts and scaling events
When to use it
PILOT_DNS_JITTER_DURATION is strongly recommended for:
- Large Istio deployments with many sidecars
- Heavy use of ServiceEntry with resolution: DNS
- Environments sensitive to DNS performance or quotas
Logging Optimization
Istio can produce a significant volume of logs when default logging is enabled at the cluster level. This excessive logging can result in performance degradation, increased storage costs, and challenges in log analysis. To optimize logging practices, it is recommended to enable error logging by default while allowing application teams to manage logging settings for their respective applications. The steps below outline how to implement this best practice:
- Add MeshConfig.ExtensionProvider.EnvoyFileAccessLogProvider at cluster level to enable cluster wide logging
extensionProviders:
   - envoyFileAccessLog:
       path: /dev/stdout
     name: envoy-access-logs
- Now create telemetry object cluster wide to only show error logs, below filter can be updated based on usage requirements:
apiVersion: telemetry.istio.io/v1alpha1
kind: Telemetry
metadata:
  name: default-exception-logging
  namespace: istio-system
spec:
  accessLogging:
    - providers:
      - name: envoy-access-logs
      filter:
        expression: "response.code >= 400 || xds.cluster_name == 'BlackHoleCluster' || xds.cluster_name == 'PassthroughCluster'"
- For production setups, it is recommended to set up info access logging for Istio gateways as well for Istio gateways, enable that with below telemetry object:
apiVersion: telemetry.istio.io/v1alpha1
kind: Telemetry
metadata:
name: disable-providers-envoy-access-logs
namespace: istio-gateways
spec:
accessLogging:
    - providers:
      - name: envoy-access-logs
- Application teams will now only see the minimum required error logs as mentioned in the filter at istio-system namespace level and if needed on demand can enable logging for their workloads via below Telemetry object:
apiVersion: telemetry.istio.io/v1alpha1
kind: Telemetry
metadata:
    name: myapp-telemetry
    namespace: mynamespace
spec:
    accessLogging:
    - providers:
      - name: envoy-access-logs
    selector:
      matchLabels:
        app: myapp
Metrics Optimization
Istio offers a wide range of additional metrics that can be easily enabled or disabled, as outlined below. However, leveraging these metrics comes with trade-offs in resource consumption and system complexity. Therefore, it is advisable to enable only the necessary metrics in production environments, while maintaining the flexibility to toggle metrics on or off in development and testing environments. Here’s an overview of the potential impacts:
Enabling additional metrics:
annotations:
          proxyStatsMatcher:    ## this part is adding additional metrics
            inclusionRegexps:
              - ".*upstream_rq_.*"
              - ".*upstream_cx_.*"
              - ".*downstream_rq_.*"
              - ".*downstream_cx_.*"
Increased Resource Usage:
- Collecting and exporting additional metrics increases CPU and memory usage for the Envoy sidecar proxies.
- The Prometheus server may also consume more resources to scrape, store, and query the expanded dataset.
Higher Network Overhead:
- Exporting metrics from sidecars to telemetry systems generates additional network traffic.
- This can impact overall cluster performance, especially in high-traffic environments.
Storage Requirements:
- More metrics mean larger storage requirements for time-series databases like Prometheus.
- Long-term retention policies may need adjustment to accommodate the increased data volume.
Conclusion
Running Istio at enterprise scale requires deliberate trade-offs rather than enabling every feature by default. As environments grow, unmanaged observability, retries, sidecars, and configuration sprawl can introduce significant performance and operational overhead.
A more thoughtful approach goes a long way: focus on high-signal telemetry, right-sizing sidecars, lean on L4 over L7 when possible, and be selective about when to use retries. Keeping configuration scope controlled is equally important to ensure the control plane remains scalable and predictable.
Advanced patterns like Smart DNS proxies can be useful in targeted scenarios, but they introduce additional DNS load and should be adopted cautiously with clear justification and monitoring.
Ultimately, successful Istio operations depend on continuous tuning—measuring impact, refining configurations, and evolving alongside workload and traffic changes.
*Note: Istio is an open-source technology.
About the Author